Probiotics 50 Billion
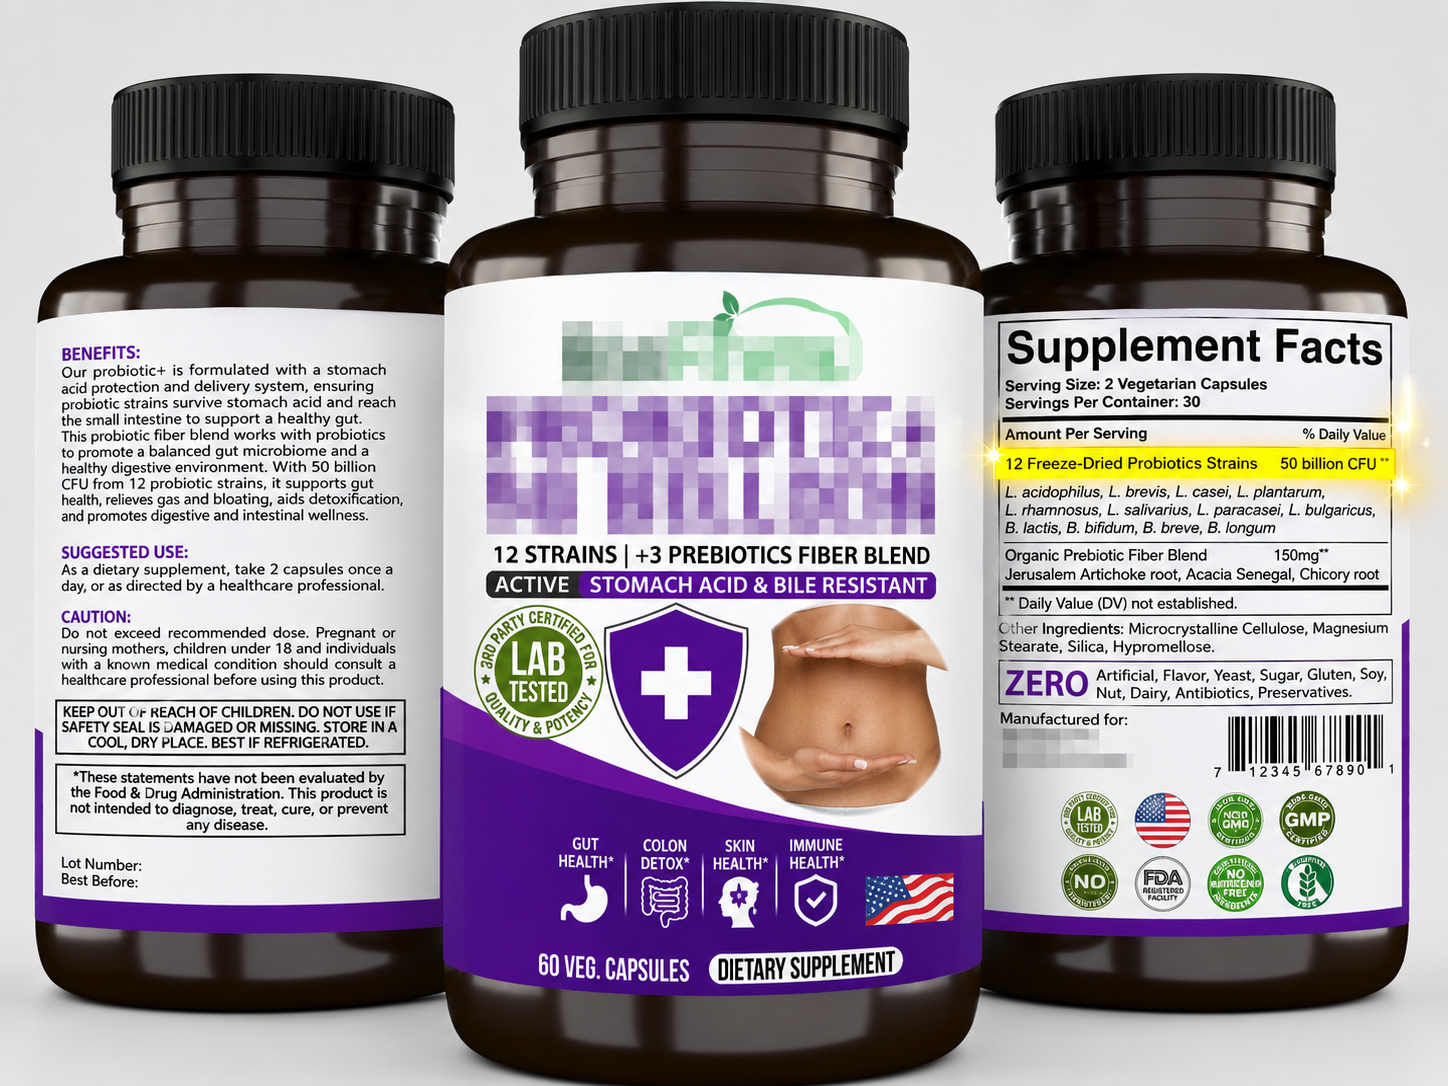
Visible wording: 12 freeze-dried probiotic strains + stomach acid and bile resistant claim
Open listingThe label starts with billions. The gut does not receive that number.
This story follows freeze-dried probiotic cells through the conditions they meet after the bottle: drying injury, storage, rehydration, stomach acid, bile, and the food or drink taken with them. The point is not to attack every probiotic. The point is to show why a number printed on a label is the beginning of the journey, not the final count.
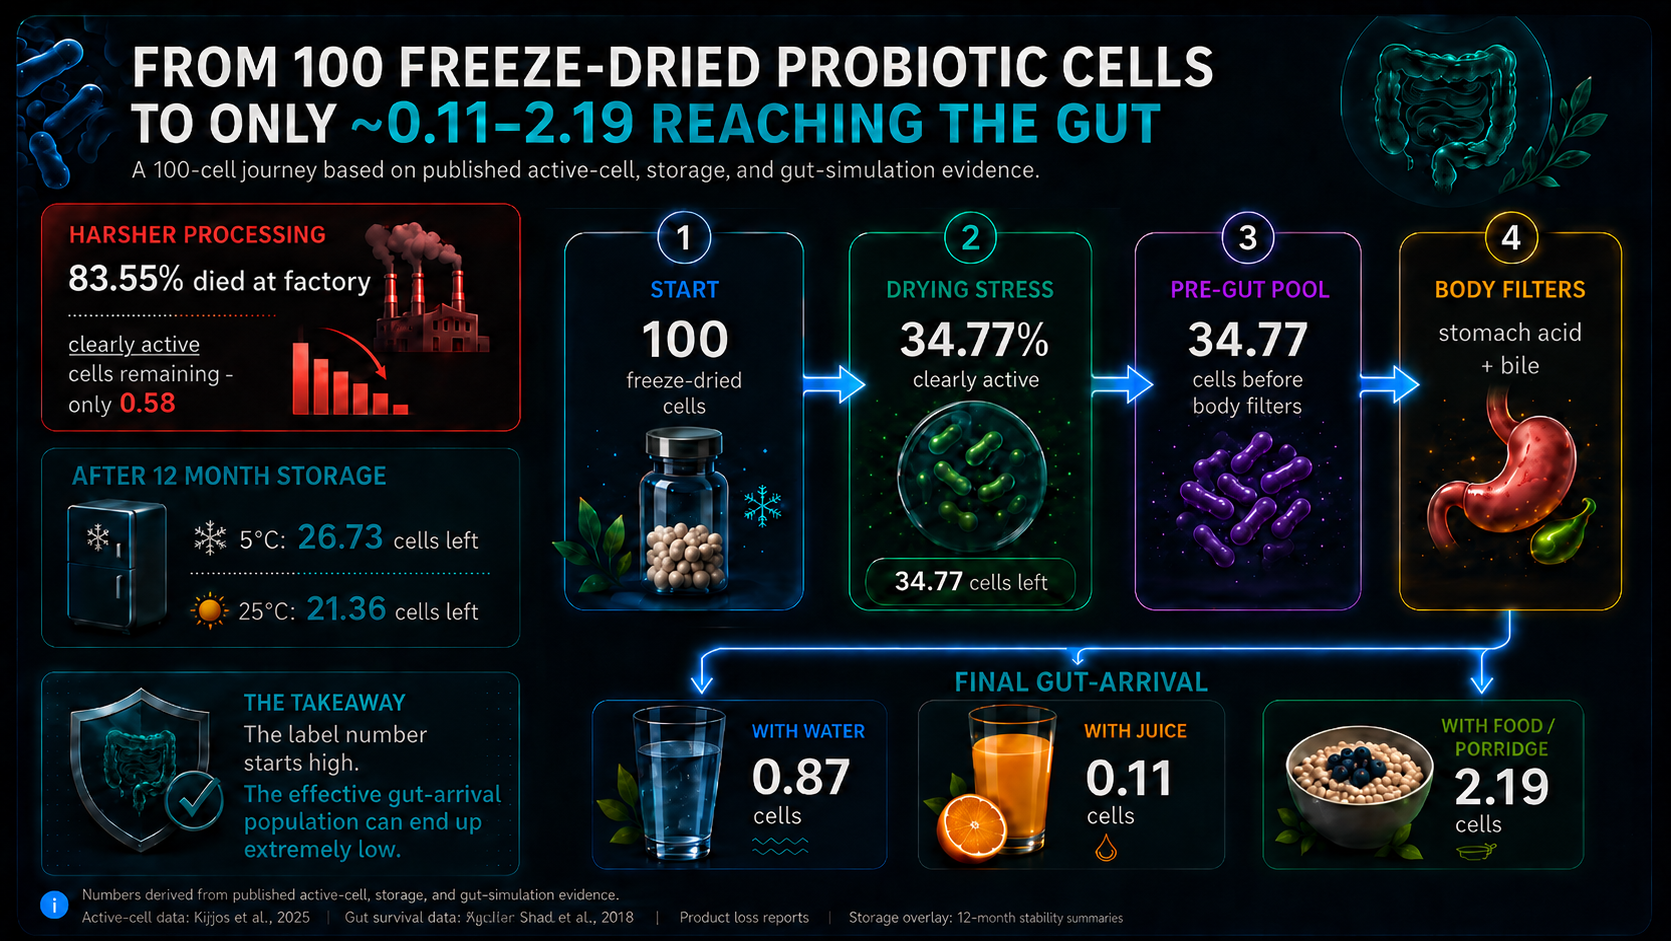
Published experiments show that the process of freeze-drying probiotics can injure cells, and body-like stresses can cut the count further. This page turns those published losses into a 100-cell model so readers can see what the number can look like after the gut journey, not only what the product starts with.
A product can start with a big number. The gut-arrival number can be much smaller.
Public market-facing snippets show survival-style claims such as “90% survival rate”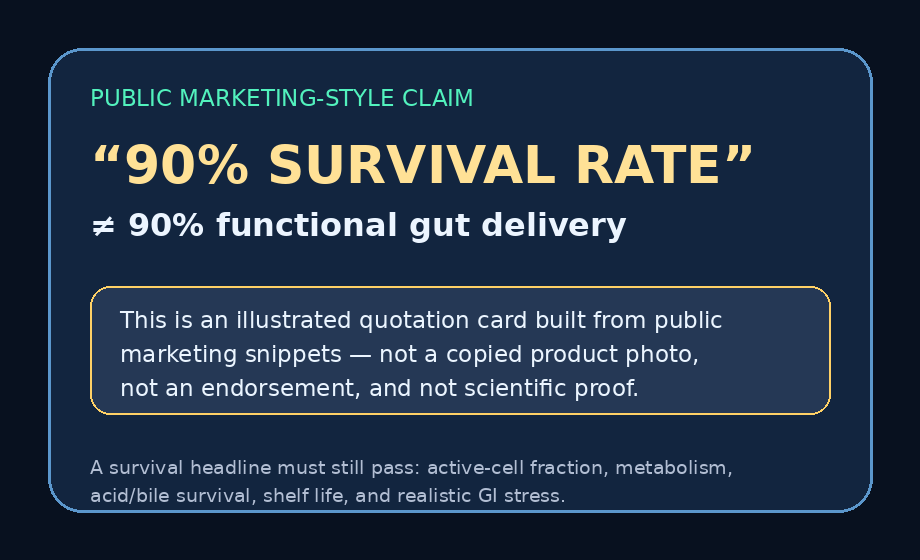 . Such claims explain why this article follows the numbers all the way through body-like stress tests. A survival headline can sound complete while leaving out the harder questions: how many cells are clearly active, how many remain viable during storage, and how many survive simulated stomach and intestinal conditions.
In the literature and product-listing search used for this report, no transparent named consumer-product dossier was found proving a ≥90% functional human-gut-delivery outcome by combining all the key layers together: active-cell fraction, metabolic function, storage performance, and realistic gut-simulation survival.
Average dead-cell share across the harsher processed batches used for the harsh-processing scenario.
Reference: Kiepś et al., 2023Average share of clearly active cells across three dried experimental batches measured by imaging flow cytometry.
Reference: Kiepś et al., 2023Corrected ordinary fresh-product outcome after the active-cell discount is carried through published gut-simulation losses.
Reference chain: Kiepś et al., 2023 + Treven et al., 2024These are sample human-use products and listings that illustrate commonly available freeze-dried probiotics online and on the shelf.
Visible wording: 12 freeze-dried probiotic strains + stomach acid and bile resistant claim
Open listing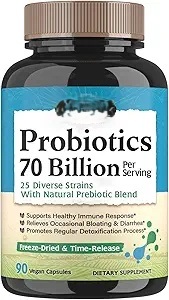
Visible wording: Probiotics + Freeze-Dried & Time-Release
Open listing
Visible wording: Freeze-Dried Yogurt Snack + live probiotics
Open listingA few acronyms decide whether a probiotic claim is meaningful. Here they are in plain English before the numbers begin.
| Term | Plain-English meaning | Why it matters | Reference |
|---|---|---|---|
| Colony-forming units (CFU) | Microbes able to multiply into visible colonies under chosen lab conditions. | Useful but incomplete: CFU does not prove immediate gut function, metabolism, adhesion, or acid/bile resilience. | NIH Office of Dietary Supplements |
| Gastrointestinal tract (GI tract) | The digestive passage from mouth through stomach and intestines. | “Reaches the gut” must survive stomach and intestinal stress, not just the factory. | NIDDK / NIH |
| Viable-but-nonculturable (VBNC) | Bacteria that show viability signs but do not grow into colonies under standard culture conditions. | VBNC cells are not credited as immediate functional gut-delivered cells here because no evidence was found to prove reliable rapid human-GI recovery for freeze-dried probiotic VBNC cells. | VBNC review, 2023 |
| Active fluorescent units (AFU) | Cells counted by fluorescent activity or membrane-integrity signals. | AFU can remain higher than CFU after storage, but signal ≠ full probiotic function. | Visciglia et al., 2022 |
| Imaging flow cytometry (IFC) | Cell analysis combining microscopy-like imaging with flow cytometry. | Separates active, mid-active, and dead subpopulations after processing stress. | Kiepś et al., 2023 PDF |
| INFOGEST | Standardized in vitro digestion method with oral, gastric, and intestinal phases. | Used as the GI-stress layer; useful screening, not a human clinical endpoint. |
This is the evidence-based story. The table below illustrates the process how freeze-dried fresh probiotics are impaired and dysfunctional through its journey into the gut:
Reference chain: Kiepś et al., 2023 — active-cell fraction × Treven et al., 2024 — INFOGEST gut-simulation losses by intake medium.
The cards below show the research checkpoints behind the 100-cell journey: drying injury, harsher processing, storage decay, intake medium, strain preparation, and unsupported revival claims.
In harsher coated/dried batches, the dead-cell percentages rose to 73.53%, 87.05%, and 90.06%, averaging 83.55% - dead, while clearly active cell averaged only 0.58%. i.e. among the remaining survived cells, only 0.58% are functional.
Source: Kiepś et al., 2023Ordinary fresh freeze-dried probiotics samples4 were analysed by imaging flow cytometry. The discovery: 36.31%, 33.23%, and 34.78% in different test-batches remains as active-cell. Only 34.77% were clearly active1.
Source: Kiepś et al., 2023For Limosilactobacillus reuteri DSM 17938, oxygen-cultivated preparation achieved 61.8% ± 2.4% freeze-dry survival, compared with 11.5% ± 4.3% under nitrogen-sparged conditions. Oxygen improved bile tolerance and 5′-nucleotidase activity but reduced acid tolerance.
Source: Rao et al., 2023A 2014 FFHD paper measured viable-but-nonculturable (VBNC) fractions in lyophilised probiotic preparations and used language like “favourable conditions,” “medical effect,” and cells reviving “once in intestines.” However, no direct quantified human-GI proof was found in the cited/search-reviewed evidence, so those statements are considered as speculation.
Source: Blinkova et al., 2014A freeze-dried claim is only the opening scene. The table illustrates how probiotics move through factory injury, active-cell remaining/discount, storage-loss, and gastrointestinal (GI) stress. Readers could see closer-to-realism drop in population reaching the gut.
The population that arrive at gut9 are in Rows 5a, 5b, and 5c at only 0.00183% to 1.69%. A 50 billion dose at 0.00183% leaves about 915,000 cells8 — tiny compared to ~38 trillion resident bacteria7 in typical adult.
| Cross-study model branches4 | Specific strain study | ||||
|---|---|---|---|---|---|
| Stage in the journey | Measured value / modelled step4 | 12 months at 5°C / 25°C | Harsher processed scenario | L. reuteri oxygen-prepared | L. reuteri nitrogen-prepared |
| 0. Factory injury gate: harsher processing check | This row applies only to the harsher processed scenario. It starts with 100 cells entering harsh processing, then leaves 16.45 non-dead cells or only 0.58 clearly active cells before gastrointestinal stress. | N/A^ | 100 → 16.45 / 0.58# | N/A^ | N/A^ |
| 1. Starting point | Starting point for products whose factory conditions were unknown | 100, then storage multiplier | 16.45 non-dead | 100 before freeze-drying | 100 before freeze-drying |
| 2. Raw freeze-dry survival | Specific strain's raw survival | N/A^ | 16.45 non-dead | 61.8% ± 2.4% | 11.5% ± 4.3% |
| 3. Active-cell remaining/discount | Average clearly active cell remaining from dried batches: 34.77% | 34.77 | 0.58# | 21.491,4 | 4.001,4 |
| 4. Pool left before reaching gut | Remaining active pool before consumption | 5°C: 26.73 25°C: 21.36 | 0.58# | 21.491,4 | 4.001,4 |
| Final destination: gut-arrival — below rows indicate what active population remains after gastrointestinal stress. | |||||
| 5a. When taken with water | Average gut-simulation survival with water = 2.51% | 5°C: 0.672% 25°C: 0.537% | 0.0146%# | 0.540% | 0.100% |
| 5b. When taken with juice | Average gut-simulation survival with juice = 0.316% | 5°C: 0.0846% 25°C: 0.0676% | 0.00183%# | 0.0680% | 0.0126% |
| 5c. When taken with porridge / food | Average gut-simulation survival with porridge = 6.31% | 5°C: 1.69% 25°C: 1.35% | 0.0366%# | 1.36% | 0.252% |
^ Separate study branch. # Clearly active cells only; harsh-column calculation uses this strict functional value, not the 16.45 non-dead upper-bound.
1 Active-cell-equivalent means a modelled value after applying the active-cell proxy from imaging-flow-cytometry data; it is not a direct clinical-function measurement.
2 “Gut” / “reach gut” means remaining after simulated gastrointestinal stress, mainly INFOGEST-style in-vitro digestion; it is not actual human gut, colon-arrival, fecal recovery, or clinical-effect measurement.
3 Simulated digestion values are direct colony-forming-unit equivalent conversions from reported log reductions, not human recovery measurements.
4 Cross-study model means values from different studies are chained to illustrate plausible decimation; it is not one finished-product experiment or a universal survival constant.
5 CFU and AFU are assay signals; neither alone proves full probiotic function.
6 VBNC recovery was not supported by direct quantified human-GI proof in the cited/search-reviewed evidence.
7 The ~38 trillion resident-bacteria comparison is numerical context only; proven probiotic effects may depend on strain-specific mechanisms, not sheer cell count.
8 As active-cell-equivalent cells1.
9 After simulated gut stress2.
| Symbol | Meaning | Value used | Basis / limitation |
|---|---|---|---|
| R_FD | Raw freeze-dry CFU survival | Study-specific; not invented where absent | Where not reported, downstream calculation starts from measured / labelled post-FD dose. This is not proof of 100% freeze-dry survival. |
| F_active | Functional-fitness discount from dried imaging-flow-cytometry samples | (36.31 + 33.23 + 34.78) / 3 = 34.77% | Active-cell drying-stress surrogate, not universal product law. |
| H_dead | Harsh coated/dried mortality | (73.53 + 87.05 + 90.06) / 3 = 83.55% | Used only for harsh-processing branch. |
| H_non_dead | Harsh non-dead remainder | 100 − 83.55 = 16.45% | Loose and generous; non-dead includes impaired cells. |
| H_active | Harsh strict active fraction | (0.99 + 0.43 + 0.32) / 3 = 0.58% | Stricter and more relevant to immediate function. |
| GI_water | INFOGEST water loss | 10^-1.6 = 2.51% | From average 1.6 log CFU decrease. |
| GI_juice | INFOGEST juice loss | 10^-2.5 = 0.316% | From average 2.5 log CFU decrease. |
| GI_porridge | INFOGEST porridge loss | 10^-1.2 = 6.31% | From average 1.2 log CFU decrease. |
Once the journey is counted step by step, the likely end point looks far smaller than the kind of high-sounding survival headline used in marketing.
| Scenario | Corrected evidence-weighted outcome | Why this is the more realistic reading |
|---|---|---|
| Harsher processed or poorly protected product | Near-zero to ~1%; clearly active harsh cases can be <0.05% | High dead-cell share before the gut stage, then another loss during gut transit. |
| Ordinary fresh non-spore freeze-dried product | ~0.11% to ~2.19% | Active-cell average carried through the water/juice/porridge gut-simulation losses. |
| Same kind of product after 12 months at 5–25°C | ~0.07% to ~1.69% | Storage pushes the pool down before the gut test even begins. |
| Food-accompanied intake without product-specific proof | About 2% in this modelled ordinary scenario4, not automatically 3–10% | Food can help relative survival, but it does not erase the injury already done. |
Some statements sound encouraging, but they do not come with quantitative parameters to support survival estimate for consumer to anchor their beliefs.
| Statement type | Source | What is missing | Decision |
|---|---|---|---|
| “VBNC cells may return to active growth.” | Blinkova et al., 2014 | No quantified pH, bile, enzymes, transit time, microbiome competition, mucus exposure, or recovery-speed proof for swallowed freeze-dried probiotic VBNC cells. | Excluded from immediate functional survival. |
| “90% survival rate / more live probiotics to your gut.” | Public marketing-style example | No transparent finished-product dossier tying together active-cell fraction, metabolic function, gut-simulation survival, and shelf-life performance. | Market context only, not calculation evidence. |
| “Freeze-dry survival can be 95.8–98.6%.” | Buahom et al., 2023 | Not proof of active-cell share, metabolic fitness, or successful gut arrival. | Raw-process context only. |
| Evidence item | Source URL | How it is used |
|---|---|---|
| Definitions of probiotics, CFU, and higher-CFU caution | NIH Office of Dietary Supplements | Terminology and caution that higher CFU does not automatically mean better effect. |
| GI tract definition | NIDDK / NIH | Plain-language definition. |
| Active/mid-active/dead dried-batch data | Kiepś et al., 2023 | Active-cell and harsher processed discounts. |
| Storage overlay | Visciglia et al., 2022 | Shows storage decay and why AFU is only an upper-bound signal. |
| Water / juice / porridge gut-simulation losses | Treven et al., 2024 | Final gut-stage multipliers. |
| Oxygen-prepared vs nitrogen-prepared L. reuteri | Rao et al., 2023 | Shows how preparation choices swing freeze-dry survival and function. |
This report is scientific and consumer-education discussion only. It is not medical advice, diagnosis, treatment, or a recommendation to start, stop, or replace any therapy.
The report does not certify, condemn, approve, or disapprove any named probiotic product. Product classification requires finished-product evidence.
INFOGEST and simulated digestion tests are useful controls, but not human clinical endpoint studies. They do not prove colonization, symptom benefit, immune effect, microbiome effect, or disease prevention.
The calculation chains evidence from different studies to show plausible decimation. It is not a validated meta-analysis or precise universal survival constant.
VBNC and mid-active cells are excluded from immediate functional survival because no direct quantified human-GI proof was found in the cited/search-reviewed evidence showing reliable rapid recovery inside realistic human GI transit for freeze-dried probiotics.
Keep limitations and source links intact. Do not convert the modeled ranges into claims about any specific brand, disease outcome, or guaranteed human effect.